Elemental microanalysis (or combustion analysis) is used to determine the masses of the elements in a sample of an organic compound in order to calculate its empirical formula.
The carbon, hydrogen and nitrogen contents are measured using an instrument known as a CHN analyser.
If other elements are present in the organic compound they must be determined by other methods.
Watch the video below for more information:
Calculate the empirical mass of a compound that contains 72 % carbon, 12 % hydrogen, and 16 % oxygen.
Solution
| Element | Mass Present | RAM | Moles present | ÷ by smallest | Whole number ratio |
|---|---|---|---|---|---|
| C | 72 | 12 | 6 | 6÷1 = 6 | 6 |
| H | 12 | 1 | 12 | 12÷1 = 12 | 12 |
| O | 16 | 16 | 1 | 1÷1 = 1 | 1 |
Empirical Formula = C6H12O
Calculate the empirical formula when:
C = 73.17%
H = 7.32%
O = 19.51%
Calculate the empirical formula when:
C = 69.77%
H = 11.63%
O = 18.60%
A sample of an organic compound with a mass of 1.224g was completely burned in oxygen and found to produce 2.340g of CO2 and 1.433g of H2O.
Calculate the empirical formula of the organic compound.
Solution
Mass of carbon = 12.0/44.0 x 2.340 = 0.638g
Mass of hydrogen = 2.0/18.0 x 1.433 = 0.159g
Mass of oxygen = 1.224 - (0.638 + 0.159) =0.427g
| Number of moles | Mole ratio | |
|---|---|---|
| C | 0.638/12 = 0.053 | 0.053/0.0267 = 2 |
| H | 0.159/1 = 0.159 | 0.159/0.0267 = 6 |
| O | 0.427/16 = 0.0267 | 0.0267/0.0267 = 1 |
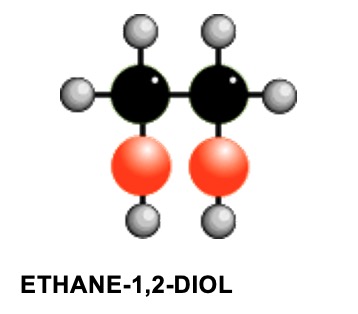
Empirical Formula = C2H6O
A sample of an organic compound with a mass of 1.224 g was completely burned in oxygen and found to produce 2.340 g of CO2 and 1.433 g of water only.
Calculate the empirical formula of the organic compound.
Oxalic acid is found in rhubarb and contains only the elements carbon, hydrogen and oxygen. When 1.540 g of oxalic acid was burned in oxygen, 1.504 g of CO2 and 0.310 g of water were formed.
1. Calculate the empirical formula for oxalic acid.
2. If the gram formula mass of oxalic acid is 90.0, what is its molecular formula?
An organometallic compound known as ferrocene contains only the elements Fe, C and H. When 1.672 g of ferrocene was combusted in oxygen, 3.962 g of CO2 and 0.810 g of water were formed.
Calculate the empirical formula of ferrocene.
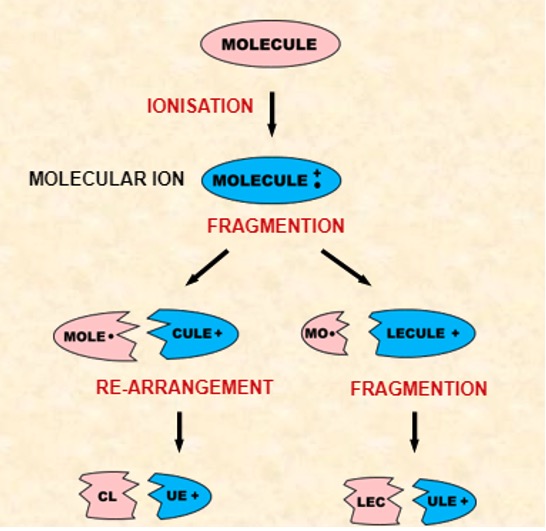
Mass spectrometry is a very powerful technique for obtaining information about molecular masses and the structure of molecules.
It requires only a very small amount of sample.
Mass spectrometry is used to identify unknown or new compounds.
The highest m/z value usually corresponds to the molecular ion. Its position provides information about the molecular mass of a substance. The tallest peaks come from the most stable species.
Interpretation of thousands of spectra has shown that many classes of organic compound show characteristic fragmentation patterns due to their functional groups.
It is possible to identify the type of compound from its spectrum by looking at the:
In the spectrum of octane, a signal occurs at 114 due to the species C8H18+
The species due to the final signal is known as the molecular ion and is usually corresponds to the molecular mass of the compound.
The small peak (M+1) at 115 due to the natural abundance (about 1%) of carbon-13. The height of this peak relative to that for the molecular ion depends on the number of carbon atoms in the molecule. The more carbons present, the larger the M+1 peak.
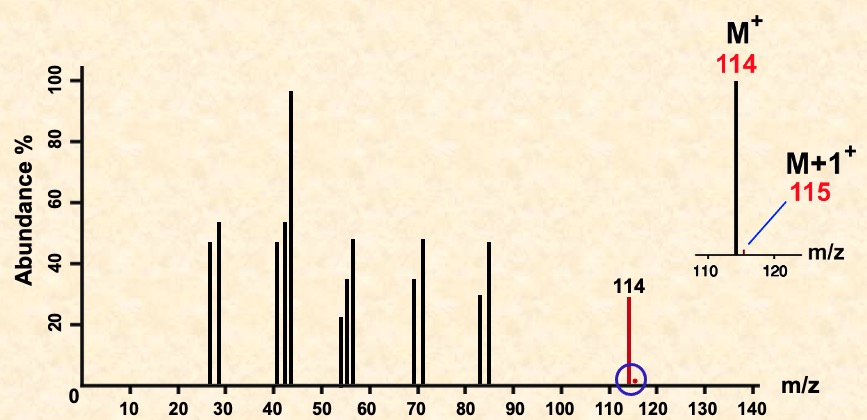
The rest of the spectrum provides additional information of the molecule's structure. Peaks appear due to characteristic fragments (e.g. 29 due to C2H5+) and differences between two peaks also indicates the loss of certain units (18 for H2O, 28 for CO).
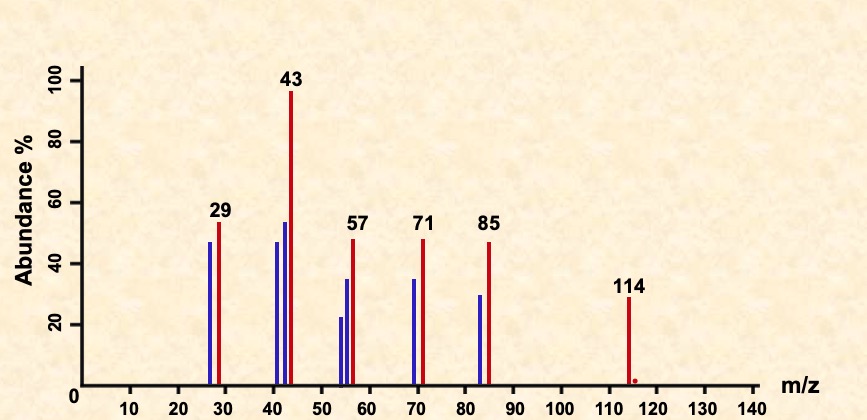
Common mass differences and suggested groups:
| Mass difference | Suggested group |
|---|---|
| 15 | CH3 |
| 17 | OH |
| 28 | C=O or C2H4 |
| 29 | C2H5 |
| 31 | CH3O |
| 45 | COOH |
| 77 | C6H5 |
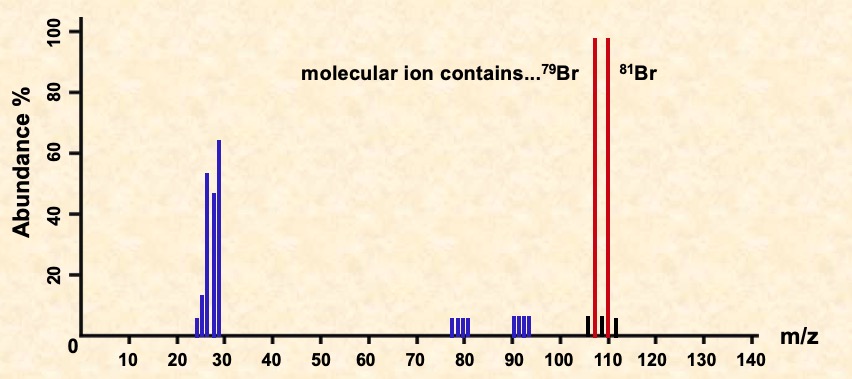
Multiple peaks occur in the molecular ion region due to different halogen isotopes. There are two peaks for the molecular ion of C2H5Br, one for the molecule containing the isotope 79Br and the other for the one with the 81Br isotope. Because the two isotopes are of similar abundance, the peaks are of similar height.
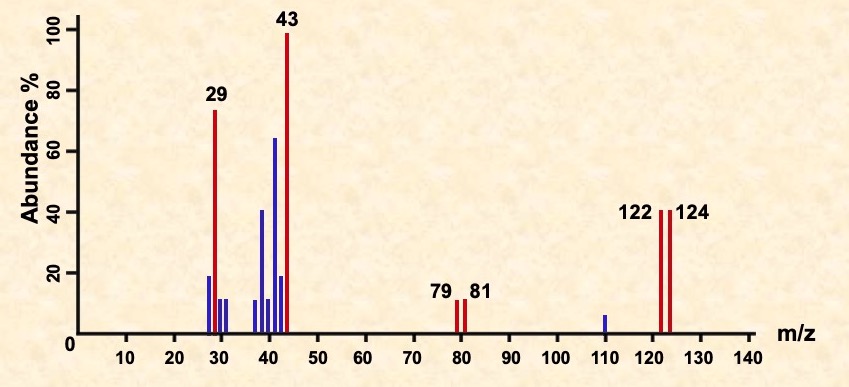
Identify the fragments in the spectra for C3H7Br shown below.
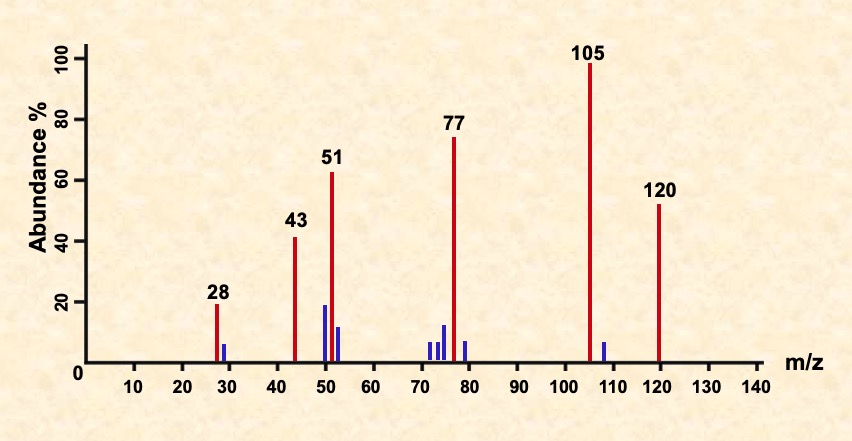
Identify the fragments in the spectra for C6H5COCH3 shown below.
A double charged molecular ion (M2+) causes a peak at exactly half the value of the corresponding singularly charged ion.
This can be seen in the mass spectrum for napthalene below.
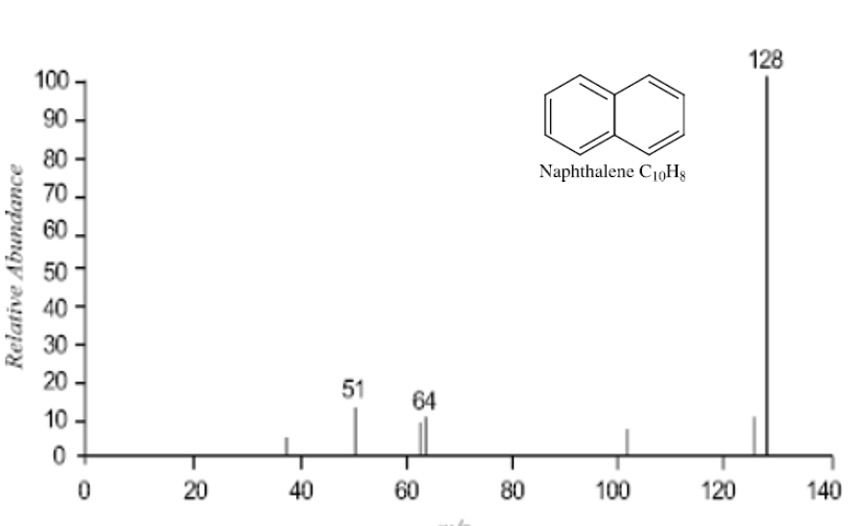
A large peak can be seen at m/z 128 corresponding to a stable molecular ion with only minor peaks else where.
The molecular ion of naphthalene is so stable that a peak at 64 is seen.
This is a double charged ion, M2+ with m = 128 and z = 2 so that m/z = 64.
This type of fragmentation pattern is fairly typical of aromatic compounds and is further evidence of the stability of this group of compounds.
When you sit in front of a fire (which gives out IR radiation) you feel warm. This is because the IR radiation absorbed by molecules in your skin is of a suitable frequency to increase their vibrational energy. The greater the molecule's vibrational energy, the hotter it is.
This is used in 'night vision' equipment which visualises changes in temperature:
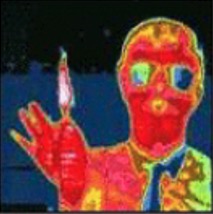
Vibrational energy levels are quantised and measuring the particular IR frequencies that are absorbed by different molecules forms the basis of IR spectroscopy.
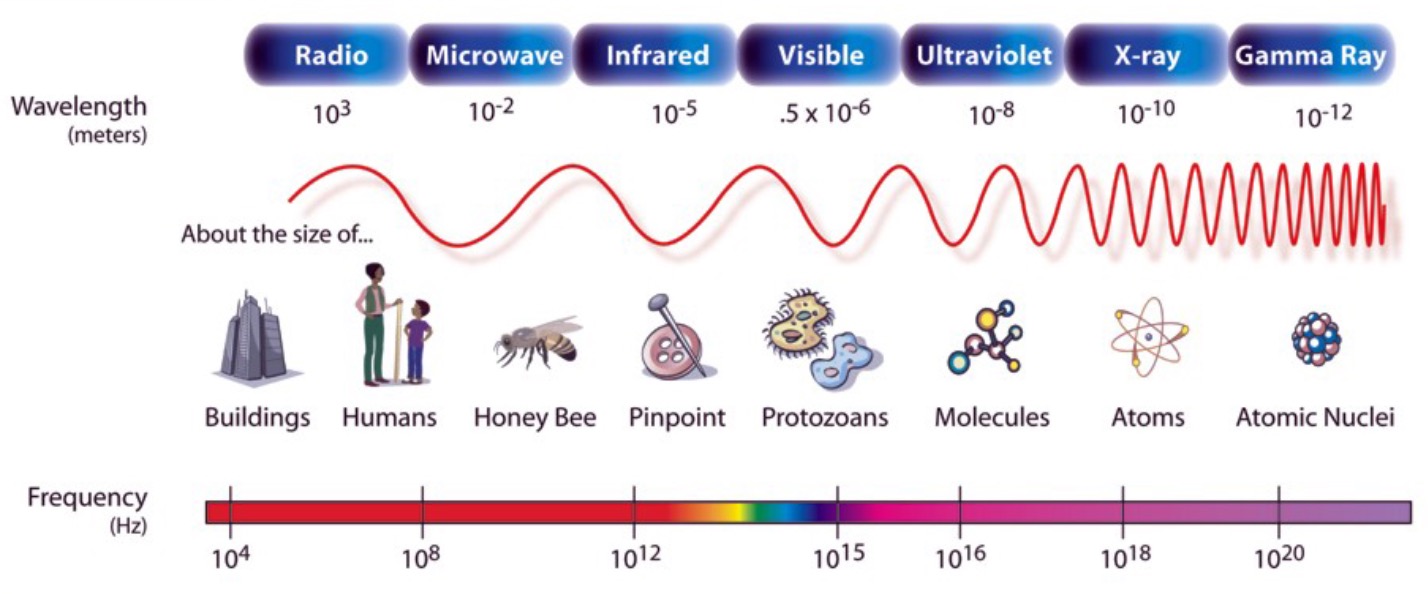
The range of IR frequencies used for spectroscopy lies between 1014 and 1013 Hz.
This corresponds to wavelengths between 2.5 and 15 μm wavelength.
Many chemists use wavenumber (the reciprocal of length in centimeters (cm-1)) to describe energies of IR radiation.
Simple diatomic molecules, e.g. halogens, have only 1 bond which can vibrate only by stretching and compressing - the 2 atoms can pull apart and then push together.
The frequency of the vibration is determined by the mass of the atoms and the strength of the bond.
If you think of it as 2 spheres attached to a spring, then the frequency of the natural vibration will decrease as the spheres increase in mass, and increase as the spring gets stronger.
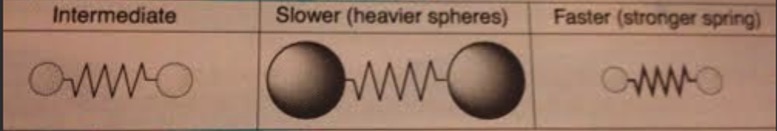
Similar principles apply to molecular vibrations.
These diatomic molecules have a single, specific frequency at which they vibrate.
When the whole range of IR frequencies is passed through a cell containing, e.g. HCl, only that frequency at which this molecule vibrates is absorbed, leaving most of the radiation to pass through intact.
Some of the HCl molecules will then vibrate at a higher quantum state. These molecules then return to the lower state by giving up the energy in collisions which alters their velocity.
Frequency of vibration for hydrogen halides and the IR absorption wavenumbers.
| Compound | Vibration freequency / Hz | IR absorption / cm-1 |
|---|---|---|
| HCl | 8.7 x 10¹³ | 2886 |
| HBr | 7.7 x 10¹³ | 2559 |
| HI | 6.7 x 10¹³ | 2230 |
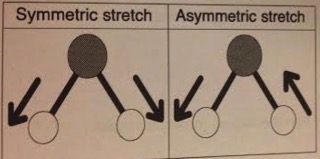
Most molecules contain more than one atom = modes of vibration other than simple stretching of bonds. E.g. Water.
Each of the O-H bonds will have a characteristic stretching frequency - these can interact symmetrically or asymmetrically giving 2 slightly different IR absorption frequencies for the O-H bonds in water
In addition to stretching, molecules can have bending modes.
H atoms in a CH2 group can move in the same plane or in and out of the plane.
All of these will have different frequencies.
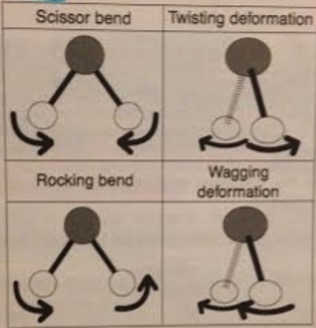
In general it takes more energy to stretch a molecule than bend it.
Molecules can vibrate in all of these fashions, and most of these will have characteristic IR absorbance wavenumbers.
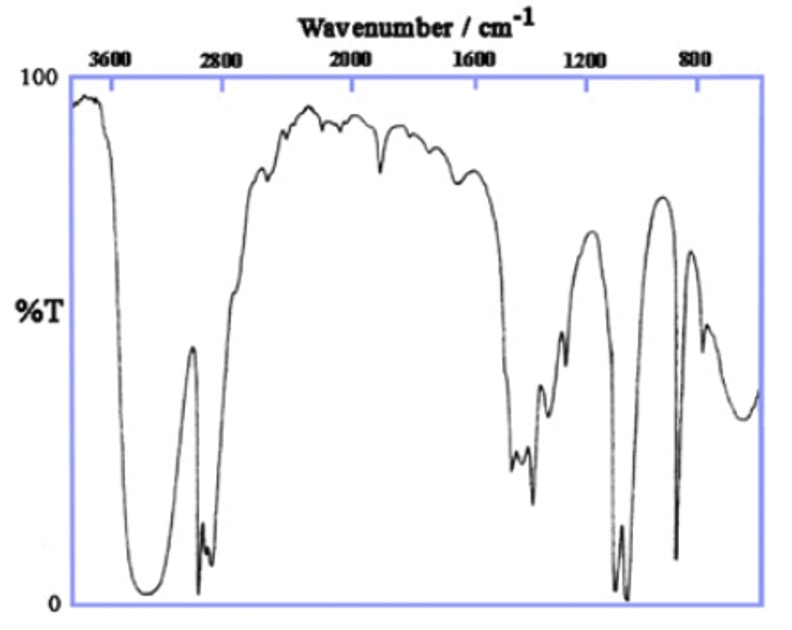
IR spectrum of liquid paraffin (mix of alkanes):
This shows the simplest IR spectrum for an organic compound consisting of only 2 types of bonds:
Many other organic compounds will have this carbon backbone with the addition of other functional groups.
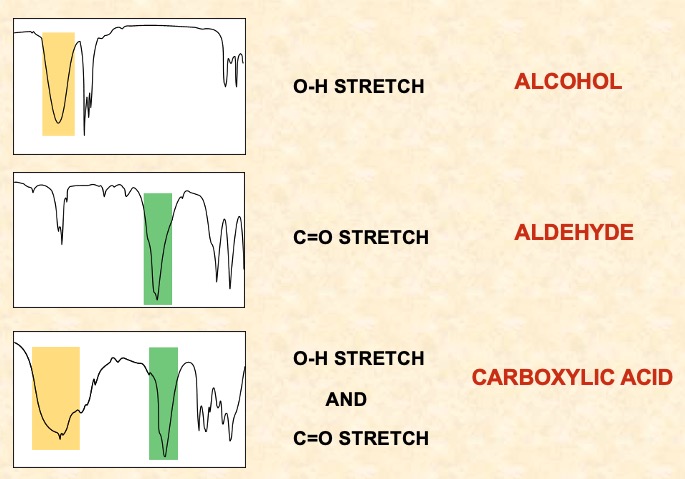
IR spectra for propanone:
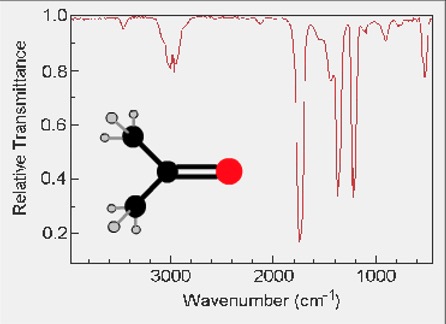
The spectrum contains some wavenumbers from vibrations of the C-H bonds but there is another strong absorbance due to the C=O at 1700 cm-1.
The C=O stretch absorbance is characteristic of ketones and occurs always around this wavenumber.
The carbonyl group also occurs in other organic compounds, such as aldehydes, carboxylic acids and esters.
The C=O stretch frequency changes slightly when the group is not directly connected to alkyl or aryl groups and with be found with other wavenumber characteristics of that group.
Another common group is hydroxyl found in alcohols and phenols.
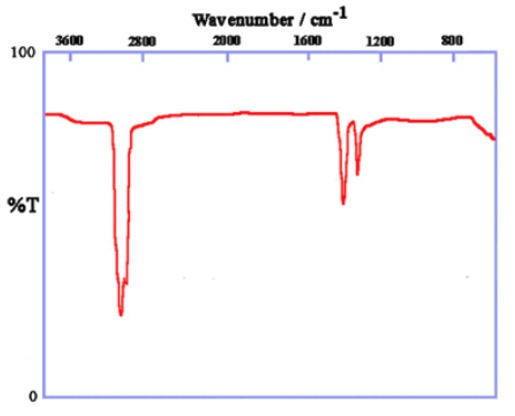
IR spectra of ethanol
Wavenumber of O-H stretch about 3400 cm-1.
All alcohols show a broad absorption between 3200 and 3600 cm-1. This is due to the presence of the O-H bond.
Identifying stretches on IR spectra.
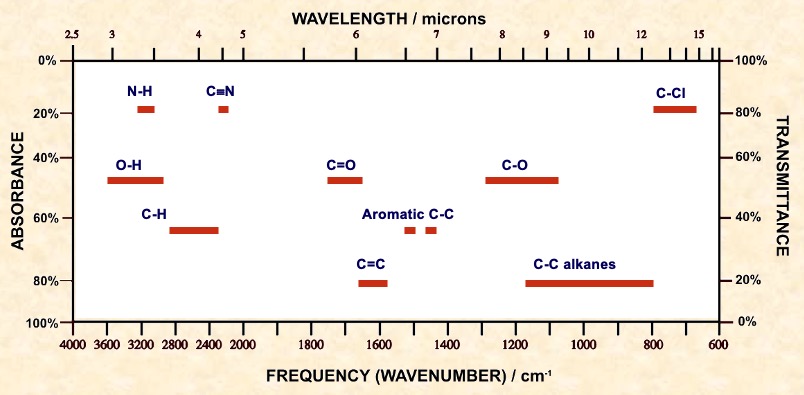
| Bond | Class of compound | Range / cm-1 | Intensity |
|---|---|---|---|
| C-H | Alkane | 2965 - 2850 | strong |
| C-C | Alkane | 1200 - 700 | weak |
| C=C | Alkane | 1680 - 1620 | variable |
| C=O | Ketone | 1725 - 1705 | strong |
| Aldehyde | 1740 - 1720 | strong | |
| Carboxylic Acid | 1725 - 1700 | strong | |
| Ester | 1750 - 1730 | strong | |
| Amide | 1700 - 1630 | strong | |
| C-O | Alcohol, ester, acid, ether | 1300 - 1000 | strong |
| O-H | Alcohol (monomer) | 3650 - 3590 | variable, sharp |
| Alcohol (H-bonded) | 3420 - 3200 | strong, broad | |
| Carboxylic Acid (H-bonded) | 3300 - 3250 | variable, broad | |
| N-H | Amine, Amide | 3500 (approx) | medium |
| C≡N | nitrile | 2260 - 2240 | medium |
| C-X | Chloride | 800 - 600 | strong |
| Bromide | 600 - 500 | strong | |
| Iodide | 500 (approx) | strong |
Because IR absorbance wavenumbers are common for a particular group in any compound, tables have been built up by observation of a large number of compounds.
This can be found on page 15 of the data book.
There are a range of values for a particular group because the value is slightly altered by the surrounding groups.
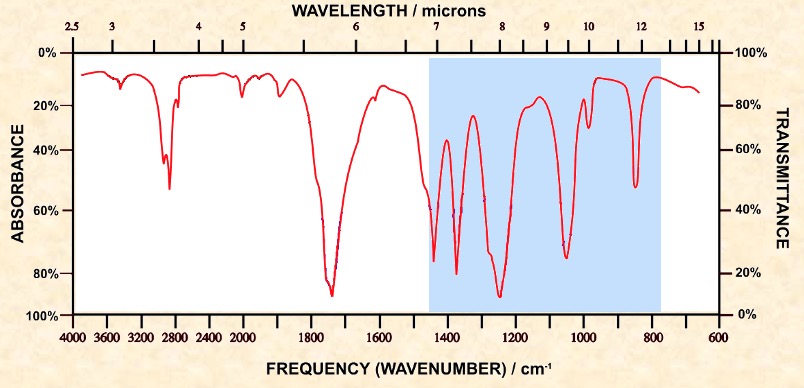
Organic molecules have a lot of C-C and C-H bonds within their structure. Spectra obtained will have peaks in the 1400 cm-1 to 800 cm-1 range. This is referred to as the 'fingerprint' region. the pattern obtained is characteristic of a particular compound the frequency of any absorption is also affected by adjoining atoms or groups.
The main use of IR is to identify the presence of functional groups and the carbon backbone type in unknown organic compounds.
Proton nuclear magnetic resonance spectroscopy provides information about the hydrogen atoms in molecules.
It involves the interaction of materials with the LOW ENERGY RADIO WAVES.
It provides the information by spinning a sample of the compound in a magnetic field.
Hydrogen atoms in different environments respond differently to the field. Each different environment of hydrogen produces a signal in a different position. The area under each peak / signal is proportional to the number of hydrogens. The signal can be split according to how many H's are on adjacent atoms.
NMR spectra provide information about the structure of organic molecules from the:
The molecule contains four methyl groups attached to a silicon atom in a tetrahedral arrangement. All the hydrogen atoms are chemically equivalent.
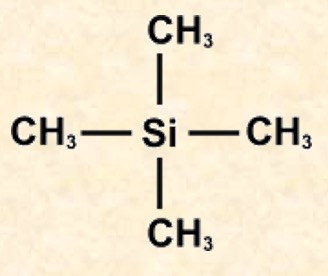
Tetramethylsilane is used to provide the reference signal because:
Each proton type is said to be chemically shifted relative to a standard (usually TMS). The chemical shift is the difference between the field strength at which it absorbs and the field strength at which TMS protons absorb. The delta (δ) scale is widely used as a means of reporting chemical shifts.
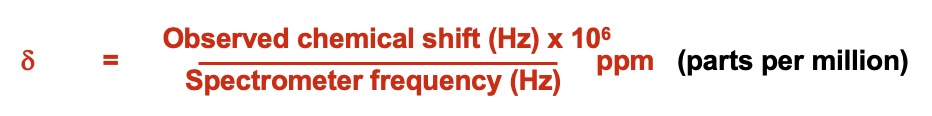
The chemical shift of a proton is constant under the same conditions (solvent, temperature). The TMS peak is assigned a value of ZERO (δ = 0.00). All peaks of a sample under study are related to it and reported in parts per million. H's near to an electronegative species are shifted 'downfield' to higher δ values.
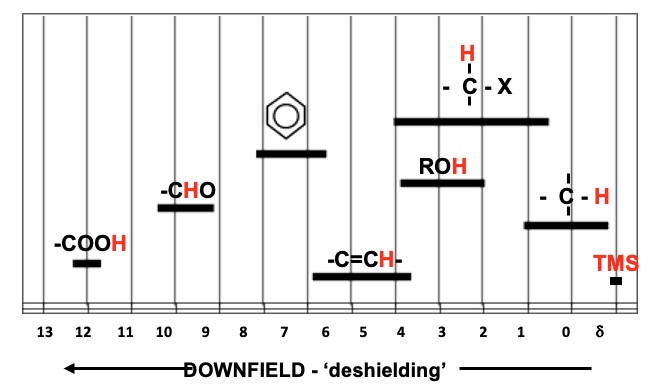
Approximate chemical shifts can be seen below. The actual values depend on the environment.
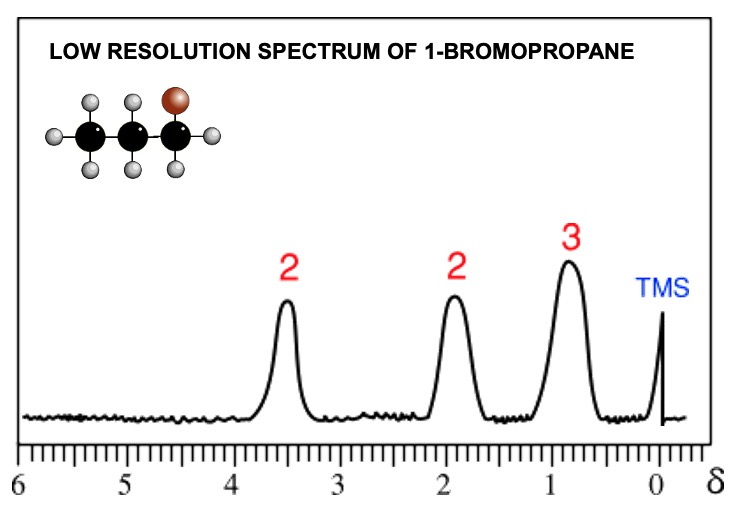
Low resolution nmr gives 1 peak for each environmentally different group of protons.
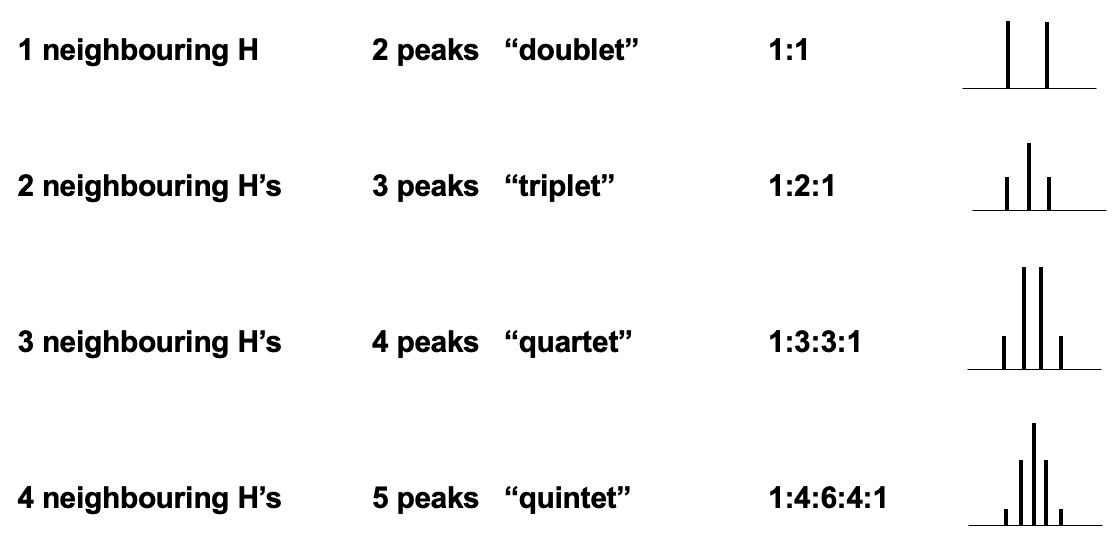
High resolution gives more complex signals - doublets, triplets, quartets, multiplets. The signal produced indicates the number of protons on adjacent carbon atoms.
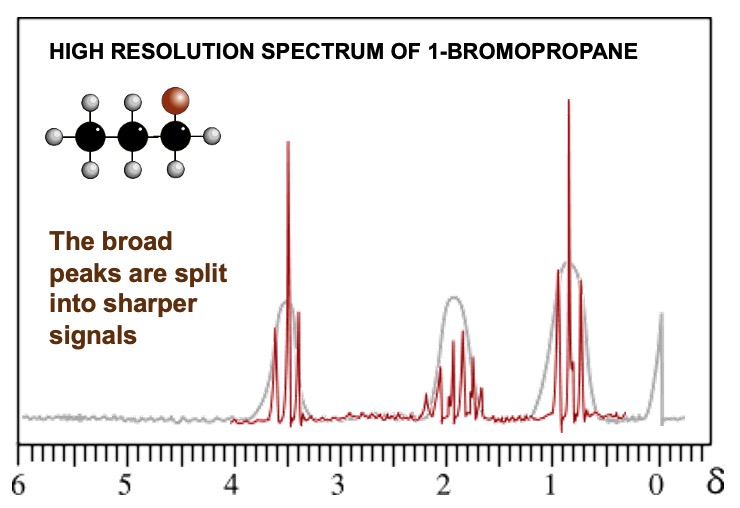
The splitting pattern depends on the number of hydrogen atoms on adjacent atoms.
Number of peaks = number of chemically different H's on adjacent atoms + 1.
Signals for the H in an O-H bond are unaffected by hydrogens on adjacent atoms - get a singlet.
| Neighboring H's | number of peaks signal is split into | term | ratio |
|---|---|---|---|
| 0 | 1 (no splitting) | singlet | |
| 1 | 2 | doublet | 1:1 |
| 2 | 3 | triplet | 1:2:1 |
| 3 | 4 | quartet | 1:3:3:1 |
| 4 | 5 | quintet | 1:4:6:4:1 |
Pascal's Triangle
The relationship between the successive peak ratios follows the pattern found in Pascal's triangle.
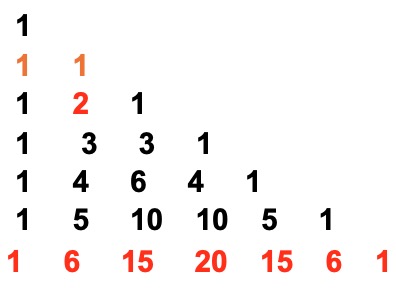
Each number in the series is the sum of the two numbers above it in the triangle.
Splitting patterns are worked out by considering the effect adjacent, chemically different protons have on another signal in a given environment.
The spin of the proton producing the signal is affected by each of the two forms of the adjacent proton.
One orientation augments/enhances its field and the other opposes/reduces it. This is done by calculating the various possible combinations of alignment of adjacent protons.
HOWEVER - Signals for the H in an O-H bond are not affected by hydrogens on adjacent atoms so are not split.
ANALOGY
Imagine you had an opinion on something. If nobody influenced you, your opinion would be the same. However if another person had a view on the topic, they would either agree or disagree with you. Their ideas would either enhance what you thought or diminish it. There would be two possibilities of equal chance.

If there were two people offering views they could either be both for it (1 possibility) , both against (1 possibility) or one could be in favour and the other against (2 possibilities). There would be three possibilities of relative chance 1:2:1.
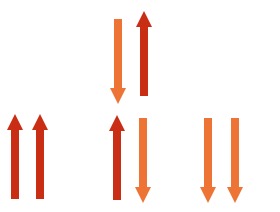
| adjacent H's | effect | spin possibilities |
|---|---|---|
| 0 | There is no effect |  |
| 1 | Can be aligned either with α or against β the field there are only two equally probable possibilities the signal is split into 2 peaks of equal intensity. | 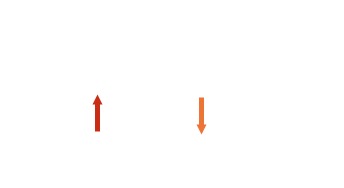 |
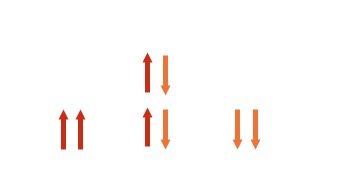
| 2 | More possible combinations get 3 peaks in the ratio 1 : 2 : 1 . |
 |
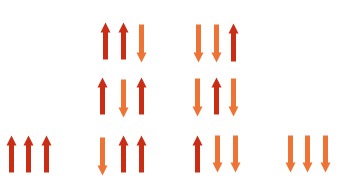
| 3 | even more possible combinations get 4 peaks in the ratio 1 : 3 : 3 : 1 |
 |
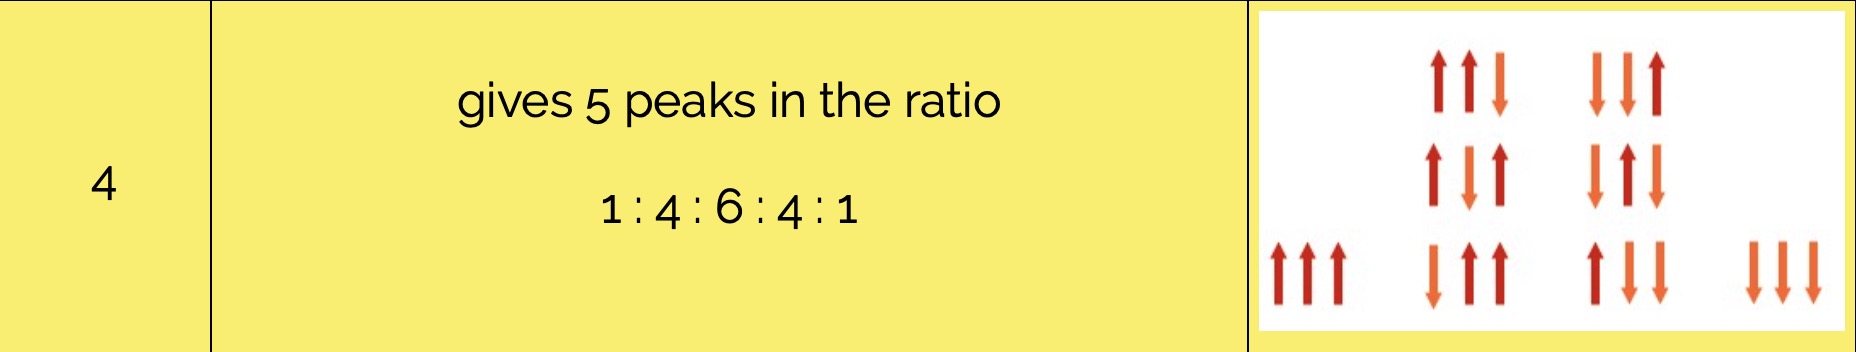
Explain the theory behind the splitting pattern for four adjacent H's.

The area under a signal is proportional to the number of hydrogen atoms present. An integration device scans the area under the peaks. Lines on the spectrum show the relative abundance of each hydrogen type (old method). Computers now display the information as numerical data.
By measuring the distances between the integration lines one can work out the simple ratio between the various types of hydrogen.
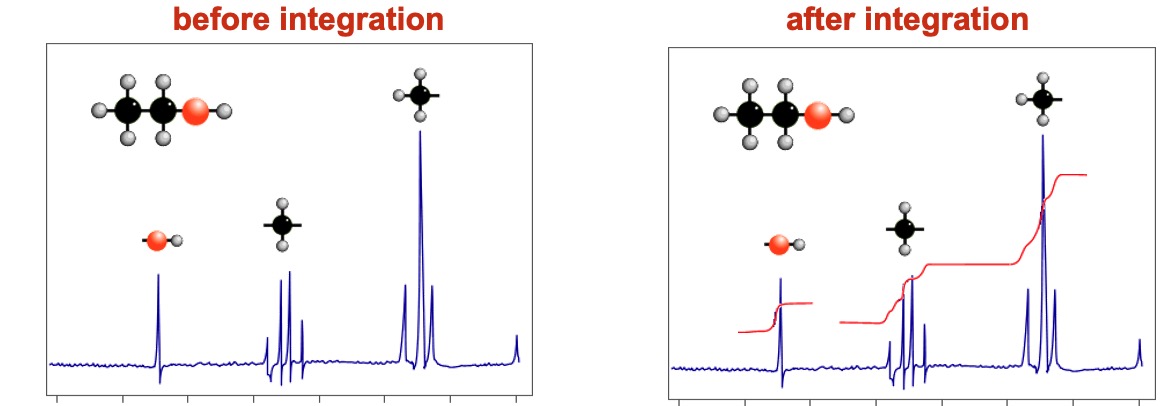
HOW TO WORK OUT THE SIMPLE RATIOS (OLD METHOD)
Measure how much each integration line rises as it goes of a set of signals. Compare the relative values and work out the simple ratio between them. In the above spectrum the rises are in the ratio... 1:2:3.
The H's on the CH2 produce a quartet despite the fact that there are 4 H's on adjacent atoms - the H on the OH doesn't couple.
NOTICE THAT THE O-H SIGNAL IS ONLY A SINGLET (see later for an explanation of this)
IMPORTANT: It doesn't provide the actual number of H's in each environment, just the ratio.
The signal due to the hydroxyl (OH) hydrogen is a singlet ... there is no splitting. H's on OH groups do not couple with adjacent hydrogen atoms.
This arises because the H on the OH, rapidly exchanges with protons on other molecules (such as water or acids) and is not attached to any particular oxygen long enough to register a splitting signal.
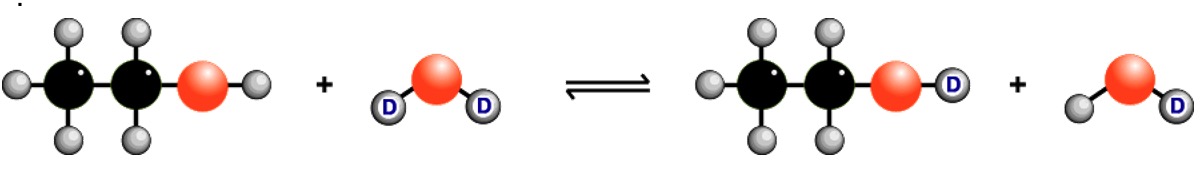
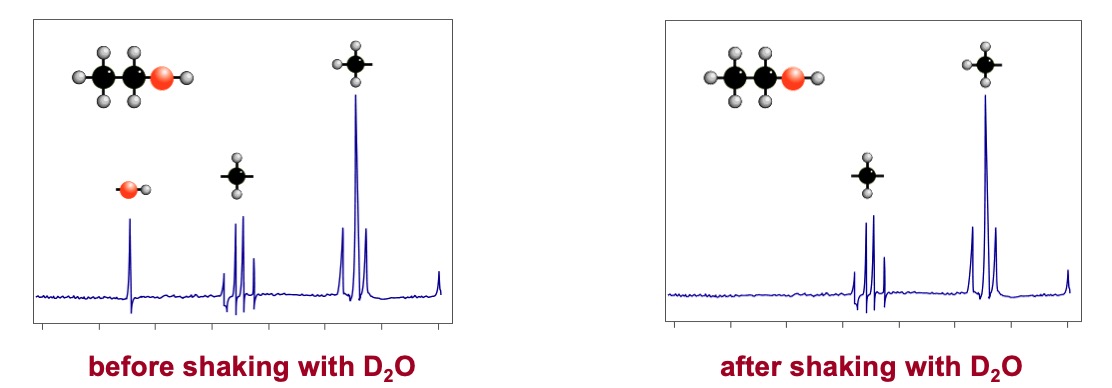
It is possible to identify which signal is caused by the H of an O-H group by doing a 'D2O shake'. A small amount of deuterium oxide D2O, a form of water, is added to the sample and the spectrum is re-run. Any signal due to O-H proton disappears.
The H in the O-H bond changes places with a deuterium atom, 2H or D, from D2O.
Deuterium doesn't exhibit nuclear magnetic resonance under the conditions used for proton nmr so the signal is removed to another part of the spectrum.
H atoms attached to the N in amines also interchange with deuterium.
TWO SIGNALS
Quartet and triplet :- ratio of peak areas = 3 : 2
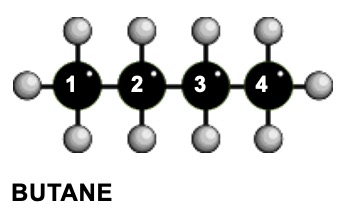
Carbons 1 & 4 are the similar and so are carbons 2 & 3 so there are only two different chemical environments. The signal for H's on carbon 2 is a quartet - you ignore the two neighbours on carbon 3 because they are chemically identical.
TWO SIGNALS
both singlets :- ratio of peak areas = 2 : 1
Hydrogens on OH groups only give singlets. The signal for H's on each carbon are not split, because:
Ask each hydrogen atom to...
BUT, REMEMBER THAT
H atoms on OH groups
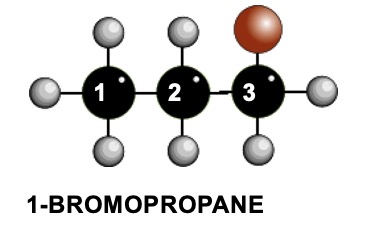
| Atom | UNIQUE DESCRIPTION OF THE POSITION OF THE HYDROGEN ATOMS | H'S ON THE ATOM | CHEMICALLY DIFFERENT H'S ON ADJACENT ATOMS | SIGNAL SPLIT INTO |
|---|---|---|---|---|
| 1 | On an end carbon, two away from the carbon with the bromine atom on it | 3 | 2 | 2 + 1 = 3 |
| 2 | On a carbon atom second from the end and one away from the carbon with the bromine atom | 2 | 3 + 2 = 5 | 5 + 1 = 6 |
| 3 | On an end carbon atom which also has the bromine atom on it | 2 | 2 | 2 + 1 = 3 |