

(ii) Absorption and Emission Spectra
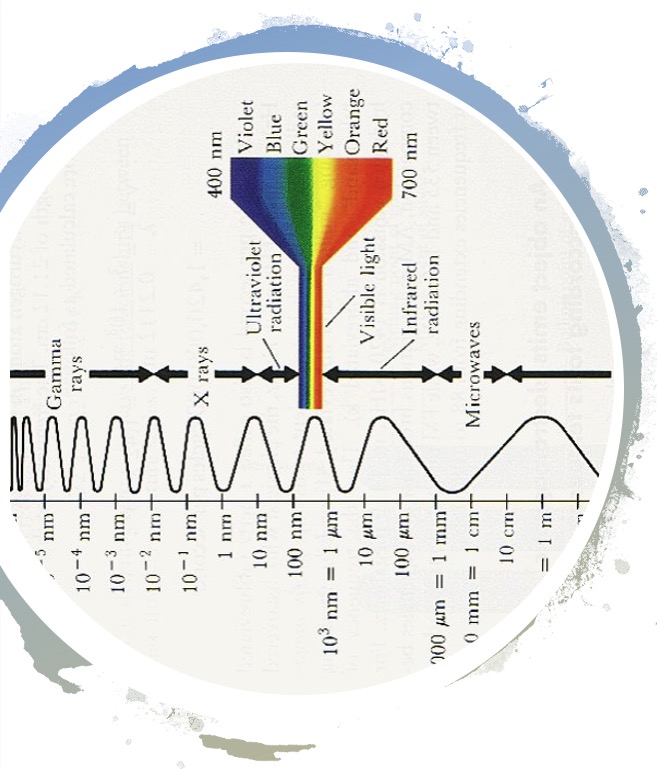
The different types of radiation arranged in order of wavelength is known as the electromagnetic spectrum.
Electromagnetic radiation can be described as a wave or a stream of particles and is said to have dual nature.
These particles are called photons.
Electromagnetic radiation can be specified by its wavelength (λ) and by its frequency (f).
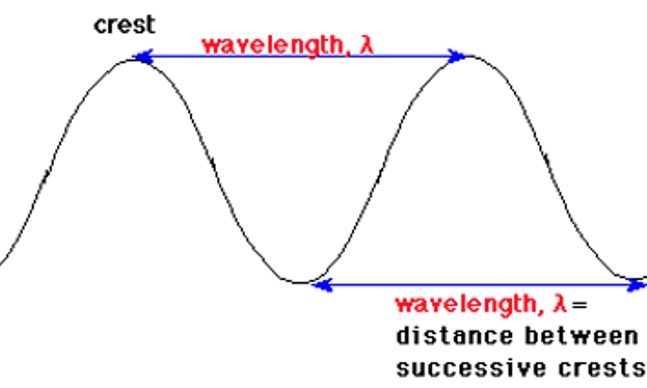
The unit of wavelength, λ, is the nanometer (1 nm = 10-9 m).
Wave number is the reciprocal of wavelength, 1/λ. This is not required any longer at Advanced higher level but you may see it in problem solving or old past papers.
The unit of frequency, f, is the reciprocal of time in seconds (s-1) and is called Hertz (Hz).
The velocity, c, of electromagnetic radiation is constant and has a value of 3 x 10⁸ ms-1.
Velocity, frequency and wavelength are related in the expression:
c = f x λ
Under certain circumstances electromagnetic radiation may be regarded as a stream of particles, rather than as waves. These particles are known as photons.
The energy of one photon is related to its frequency:
E = hf
Where h is Plank's constant: 6.63 x 10⁻³⁴ J s
The energy of one mole of photons:
E = Lhf
Where L is Avogadro's constant: 6.02 x 10²³ mol-1
Combining c = f x λ and E = Lhf gives:
E = Lhc / λ
Calculate the energy, in KJmol-1, associated with a wavelength of 671nm.
1. Calculate the energy in kJmol-1, corresponding to:
(a) a wavenumber of 1000 cm-1
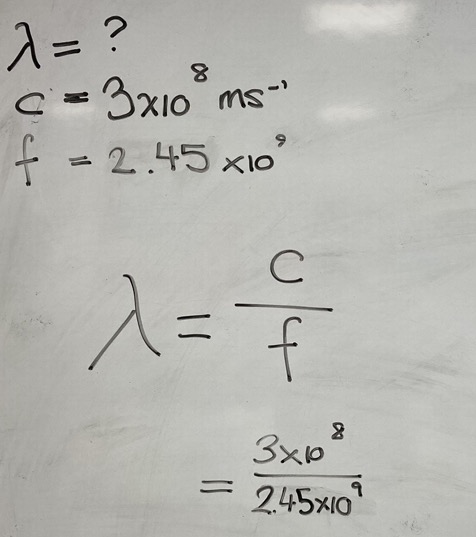
A typical microwave oven operates at a frequency of 2.45 x 10⁹ Hz. Calculate the wavelength of this radiation.
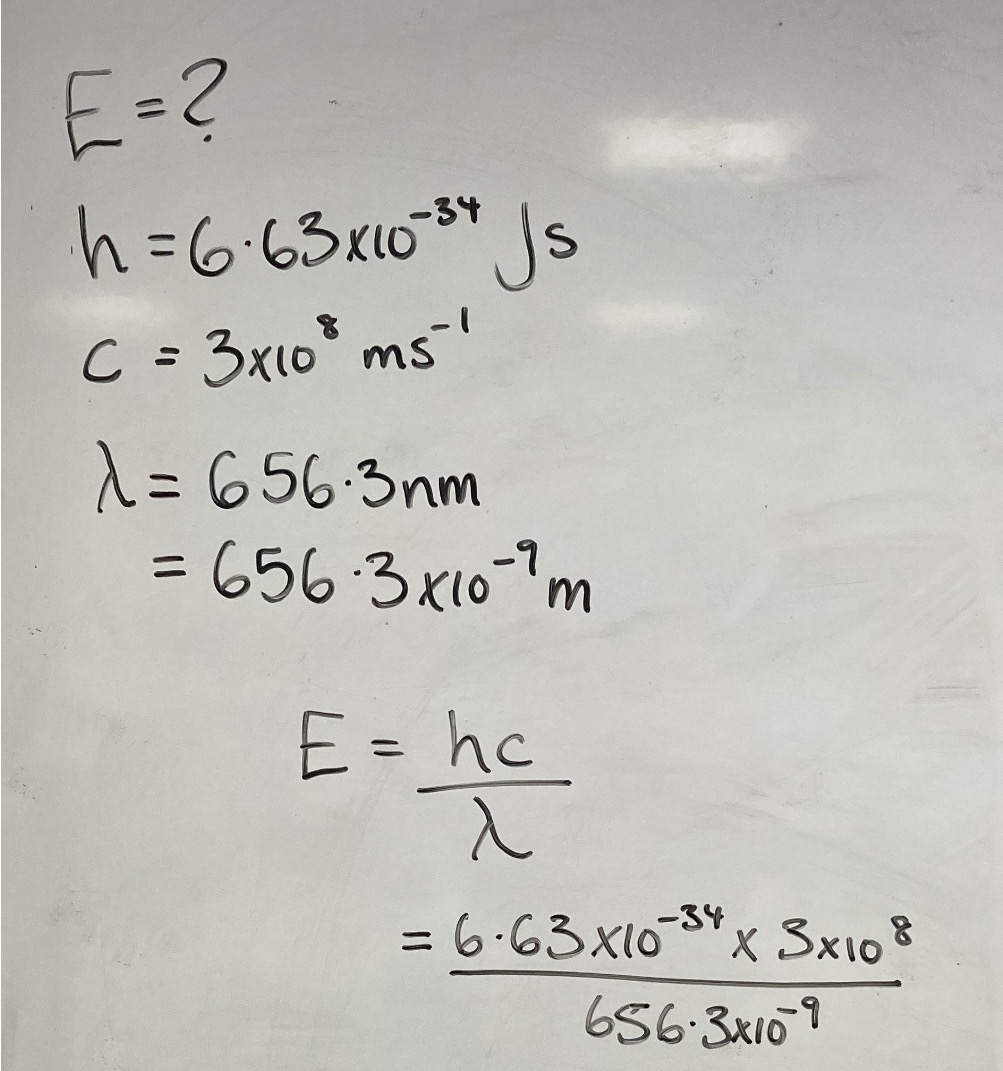
The red line in the hydrogen spectrum has a wavelength of 656.3 nm. Calculate:
(a) The energy value of one photon of light at this wavelength.
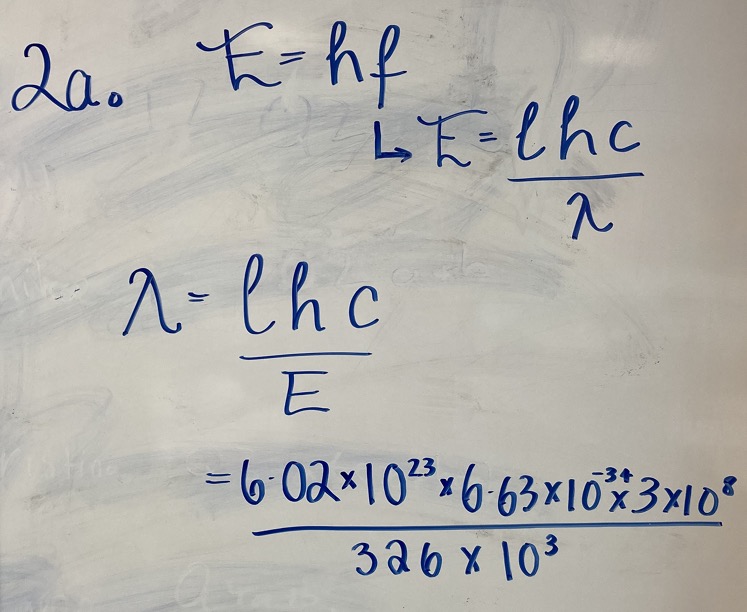
Chlorinated hydrocarbon molecules contain C-Cl bonds. The energy required to break these bonds is 326 kJmol-1.
(a) Calculate the wavelength of light required to break one mole of these bonds.
(b) By reference to the electromagnetic spectrum suggest why these molecules are unstable in the upper atmosphere.
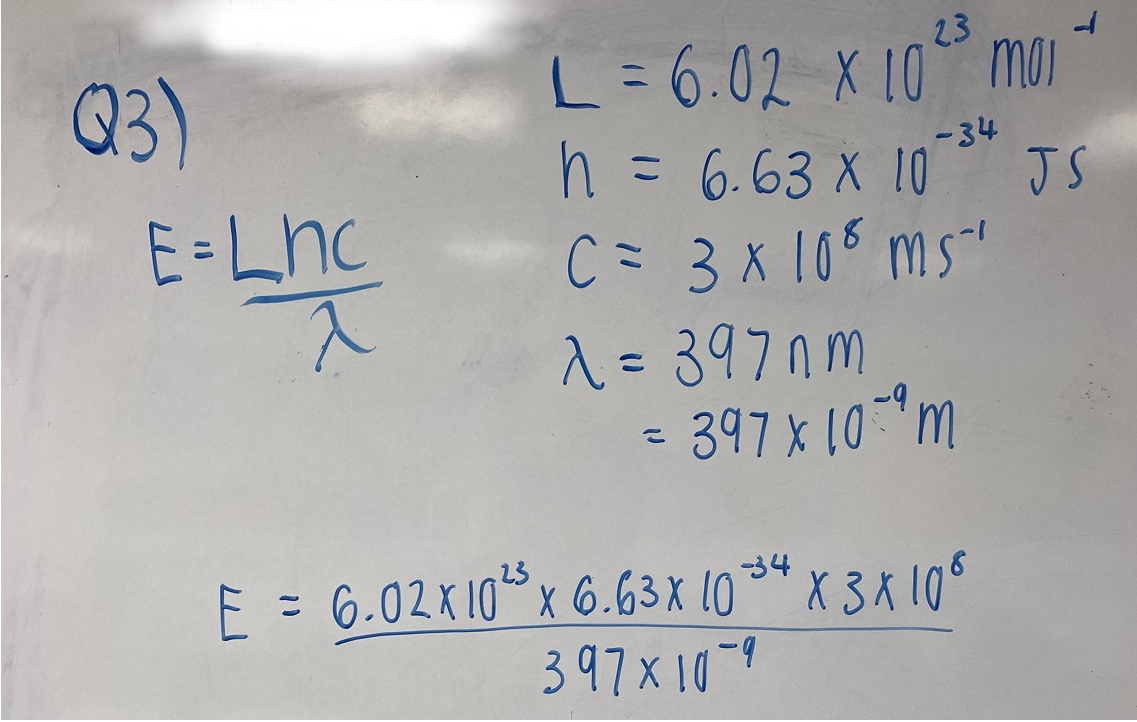
Calculate the energy, in kJ mol-1, of the electron transition that causes the line in the ultra-violet area of the hydrogen spectrum with a wavelength of 397 nm.
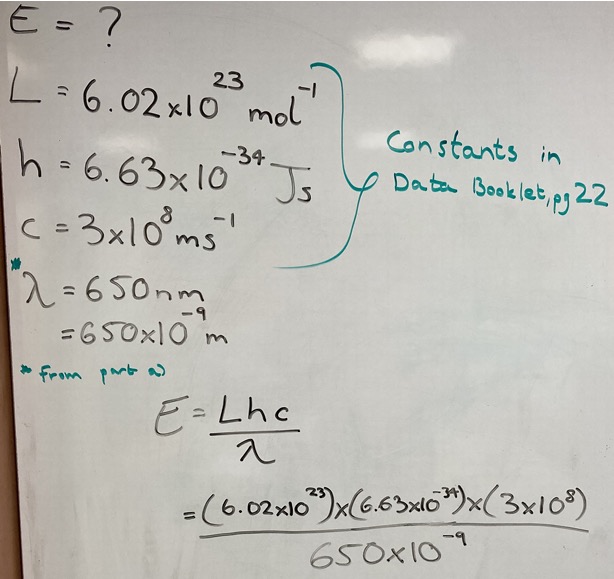
When a strontium compound is placed in a flame, a red colour appears, which has a prominent line in the spectrum.
(a) Refer to page 16 of the Data Book to obtain the wavelength of this line.
(b) Calculate the energy, in kJ mol-1, of the electron transition related to this line.
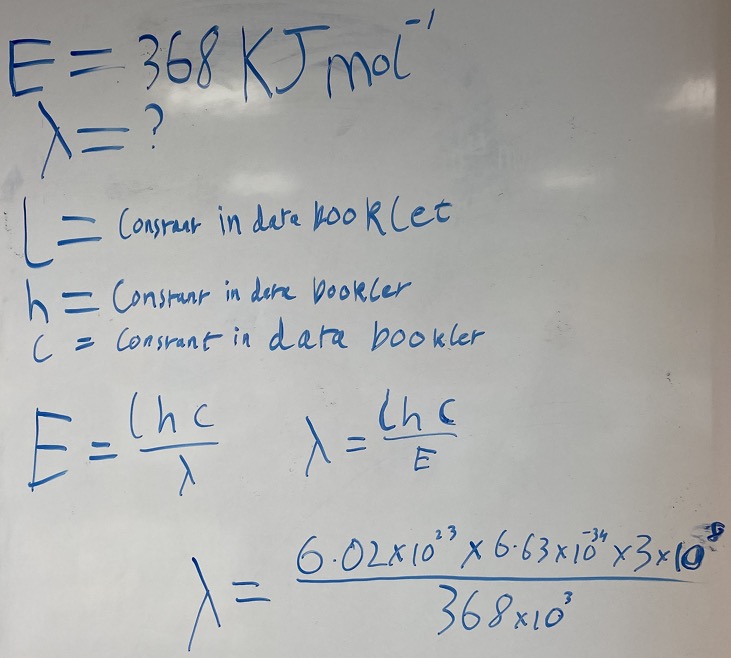
When a metal compound is placed in a flame, a flame colour appears with a main spectral line with an associated energy of 368 kJ mol-1 Calculate the wavelength of this line in nanometres.
Radiation composed of only one wavelength is called monochromatic.
Radiation that spans a whole array of different wavelengths is called continuous.
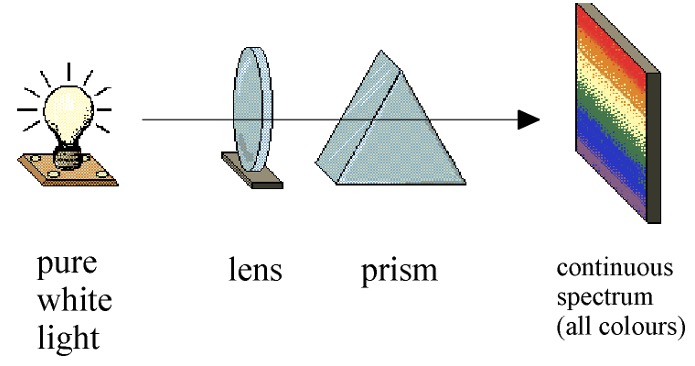
White light can be separated into a continuous spectrum of colors.
When a beam of pure white light is passed through a prism a continuous spectrum is seen (all the colours of the rainbow).
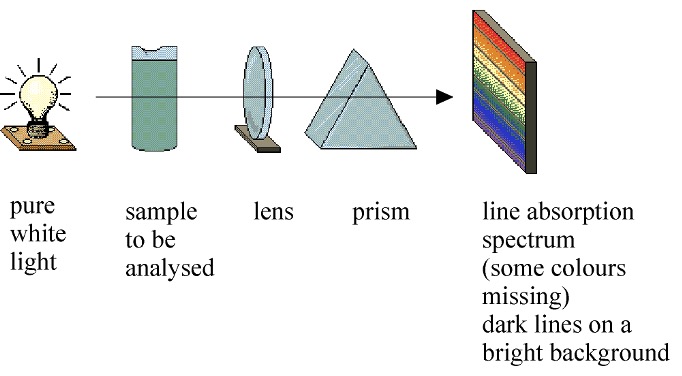
If a beam of pure white light is passed through a sample to be analysed e.g. a gaseous sample of an element, the radiation that emerges has certain wavelengths (colours) missing.
This shows up as dark lines on a continuous spectrum.
This provides a pattern that can be used in identification of an unknown sample.
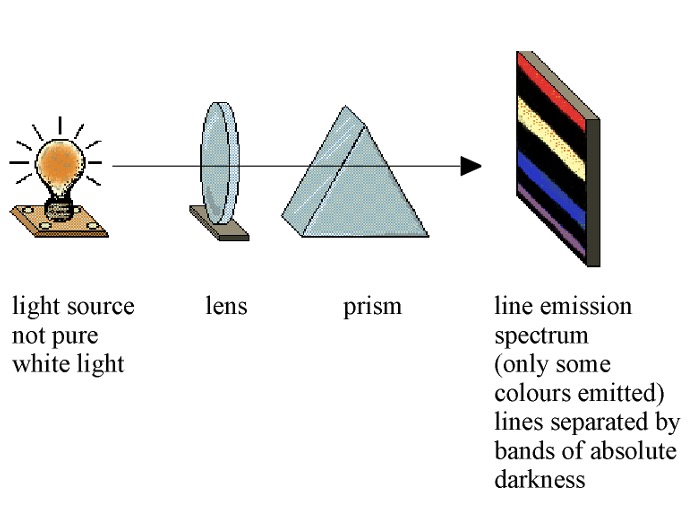
Atomic emission spectra are produced when atoms of elements, usually in their gaseous state, are excited by heat or electrical discharge so that they emit radiation.
The radiation emitted is passed through a prism and the spectrum obtained is a series of sharp coloured lines on a black background.
Physicist, Gustav Kirchhoff was able to formulate three laws to describe these spectra. Kirchhoff's laws:
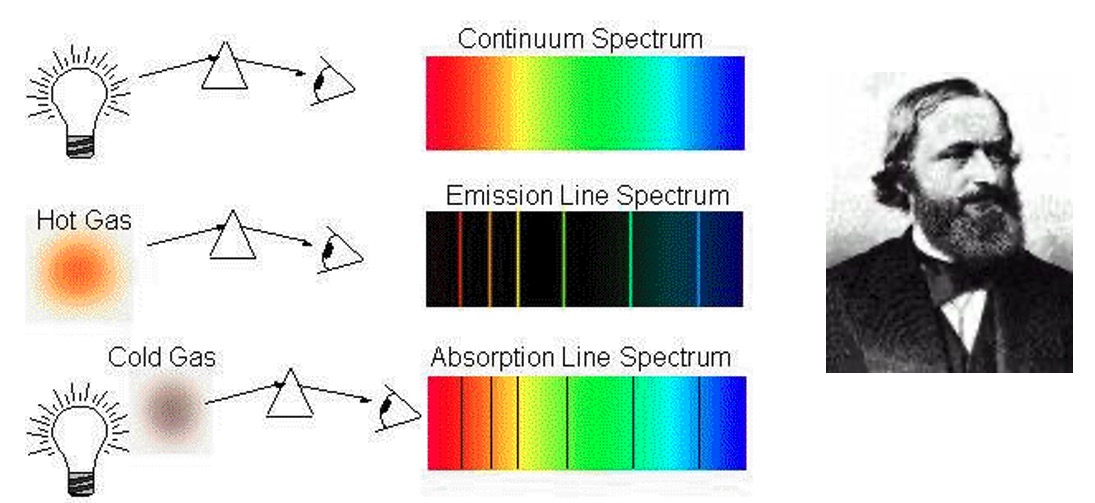
Spectra that shows energy being given out by an atom or ion are called Emission Spectra.
Lines in an emission spectra occur when an electron in its ground state is excited to a higher energy level.
The excited electron then returns to the ground state, emitting energy (light).
This energy is equal to difference in energy between the two levels involved.
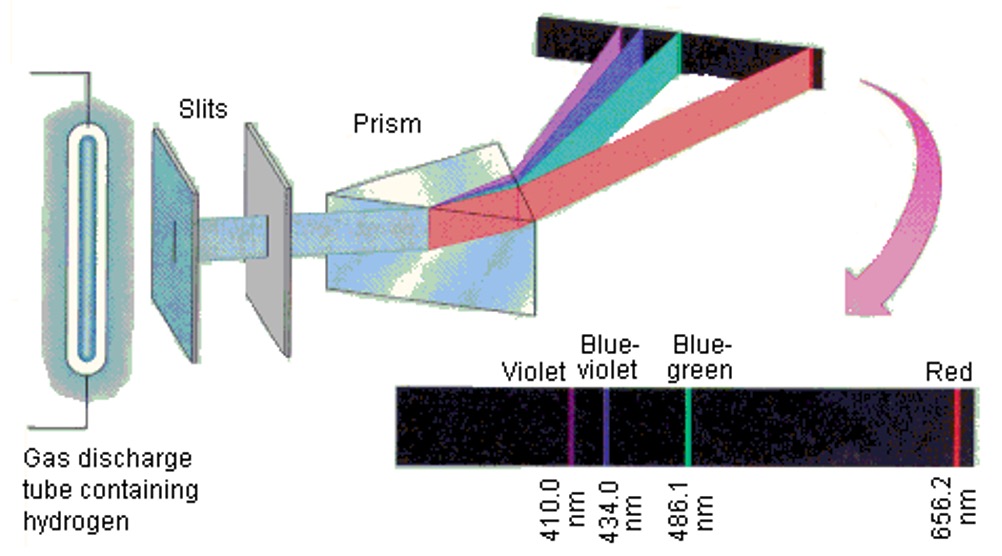
The spectrum for hydrogen has four lines: red, blue-green, blue and indigo. These lines correspond to well defined energy changes and can be calculated using E = Lhf.
Examination of the atomic emission spectrum of hydrogen shows that this consists of a number of lines (a line spectrum) of very precise frequency, corresponding to precise amounts of energy.

Using the spectra above, calculate the energy of the red line in the spectrum in kJ mol-1.
A photon of light is emitted or absorbed when an electron changes from one energy level (shell) to another.
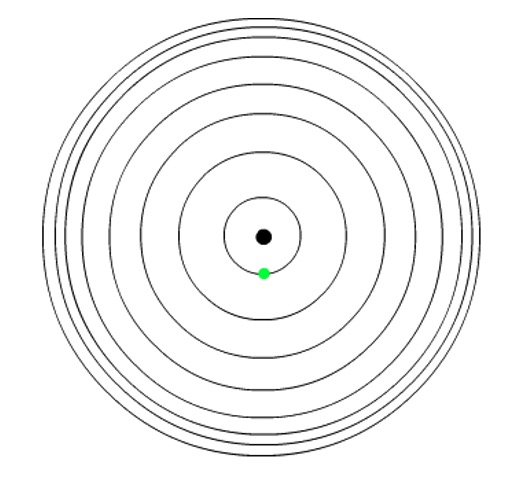
Planck: energy can only be absorbed or released from atoms in certain amounts called quanta.

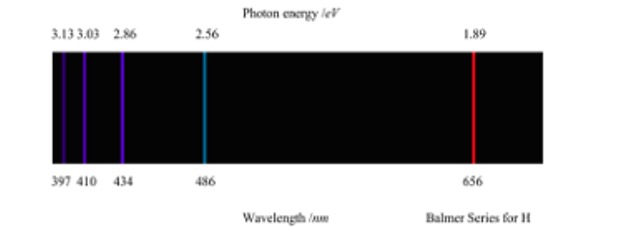
The emission spectrum of hydrogen has different series of lines in different parts of the electromagnetic spectrum. These depend on the energy level to which the 'excited' electrons fall back to.
The gaps between the energy levels decrease with increasing energy and the lines become closer and closer together until they converge. The difference in energy between the ground state and the convergence limit corresponds to the energy required for the electron to break away from the atom. This is its ionisation energy.
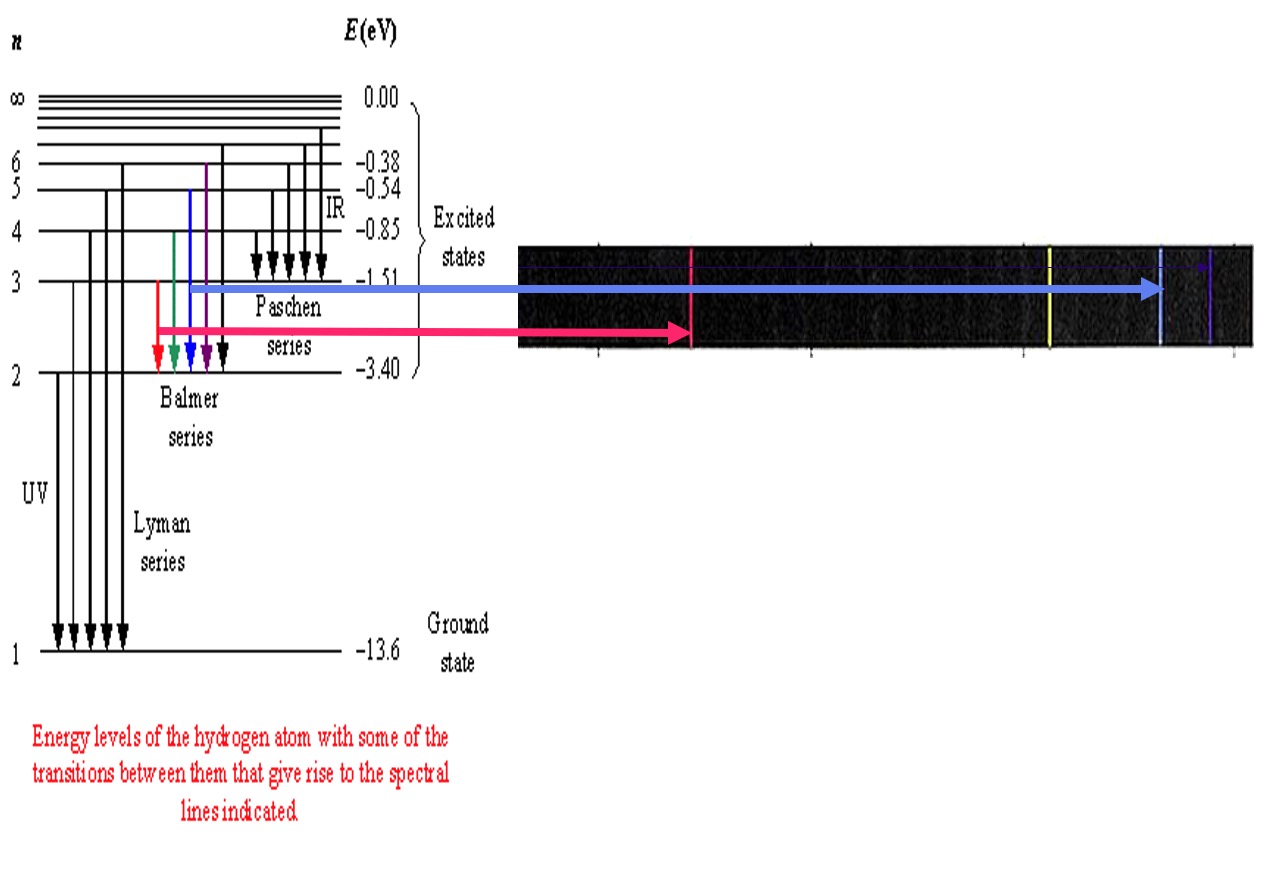
The lines detected in the visible spectrum were due to electrons returning to the n=2 level and are called the Balmer Series.
Another series of lines called the Lyman Series are due to electrons returning to the n=1 level. The DE values are higher and the lines appear in the ultra-violet region.
These series of lines are named after the scientists who discovered them.
Balmer series
Lines in the visible part of the hydrogen spectrum, produced by excited electrons falling back down to the second energy level.
Lyman Series
Lines in the ultraviolet part of the spectrum, produced by excited electrons falling back down to the first energy level (ground state).
Paschen Series
Lines in the infra red part of the spectrum, produced by electrons falling back down to the third energy levels.
Colour in Chemicals
White light can be thought of as a combination of 3 primary colours - red, green and blue.
Most of the colour we see around us is due to chemicals which absorb light from the visible spectrum. If some of the electrons in a chemical absorb energy from the red part of the spectrum the chemical will appear to be blue/green, (cyan) in colour since this is the part of the spectrum that is being reflected/ transmitted.
If green light is absorbed, a combination of red and blue light is transmitted as purple (magenta).
If red light is absorbed, a combination of green and blue light is transmitted as a blue-green colour, cyan.
If blue light is absorbed, a combination of red and green light is transmitted as yellow.
These colour combinations can be shown on a colour wheel.
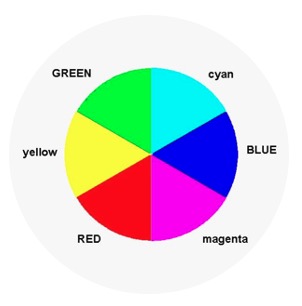
The colour being absorbed is across from the colour being transmitted.
For example, If green light is absorbed, a combination of red and blue light is transmitted as purple (magenta).
Colorimeter
A colorimeter is an instrument that can be used to determine the concentration of a solution by determining the intensity of light energy absorbed, or transmitted.
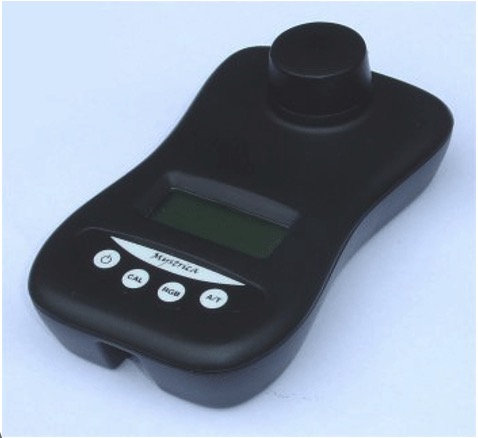
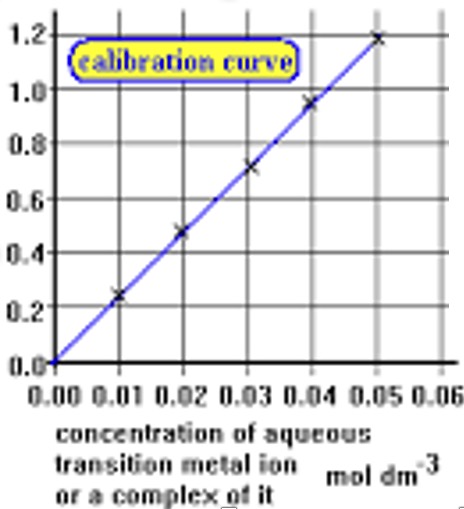
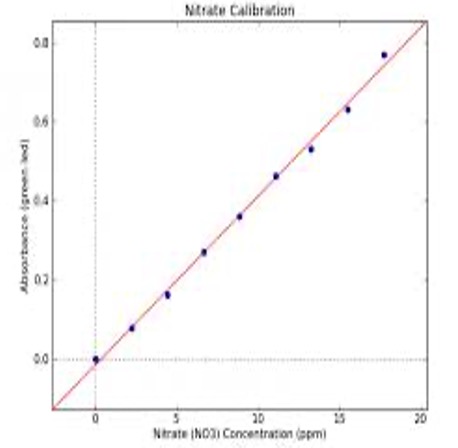
The higher the concentration of the coloured sample the higher the % of light which would be absorbed by the sample. By determining the amount of light absorbed by solutions of known concentration we can construct a calibration graph by plotting absorbance against concentration.
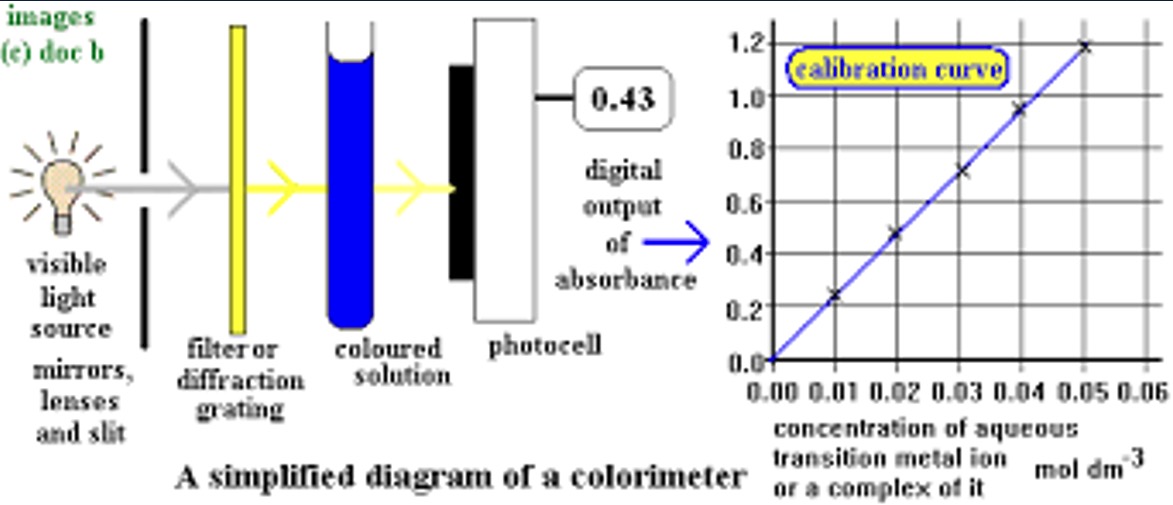
A sample of unknown concentration can then be inserted into the colorimeter and from its % absorbance we can determine its concentration using the calibration graph.
Yellow and blue are complementary colours. The yellow filter absorbs the blue light, transmitting only red and green light (yellow).
The yellow light (red + green) is then absorbed by the blue solution. No blue light is available to reflect so in fact it would appear black if we could see it.
The straight line section of the calibration graph should cover the dilution range likely to be used in the determination.
Solutions containing permanganate ions have a deep purple colour.
Explain why a wavelength such as 520nm is an appropriate choice when analysing such a solution using colorimetry. You may wish to use page 20 of the data book to assist you.