National 5 Chemistry Unit 1: Chemical Changes and Structure
Notes and experiments for National 5 Chemistry Chemical Changes and Structure. Tap a topic to open it.
- (i) Rates of Reaction
- (ii) Atomic Structure (coming soon)
- (iii) Bonding (coming soon)
- (iv) Formulae and Reacting Quantities (coming soon)
- (v) Acids and Bases (coming soon)
(i) Rates of Reaction
Signs of a Chemical Reaction
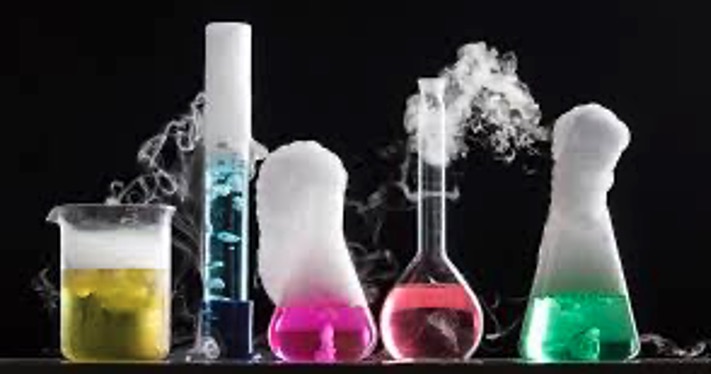
- Colour Change
- Energy Change (temperature, light, sound)
- Precipitate (solid) formed
- Effervescence (bubbling)
Speeding up Reactions
A chemical reaction can only occur if there is a successful collision between reactant molecules.
We can speed up a chemical reaction by:
- Decreasing particle size (increasing surface area)
- Increasing concentration (of reactant)
- Increasing temperature
- Adding a catalyst (this is recovered chemically unchanged at the end of the reaction)
Particle Size
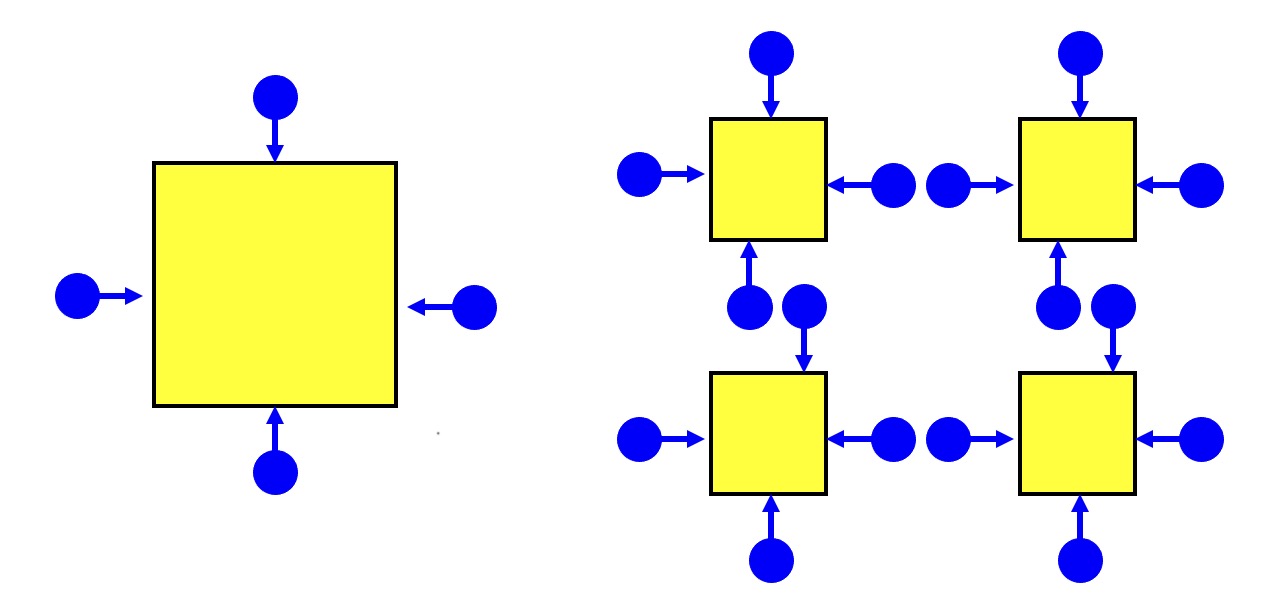
The smaller the particle size, the higher the surface area.
The higher the surface area, the greater the number of collisions that can occur at any one time.
The greater the number of collisions, the faster the reaction.
Therefore the smaller the particle size, the faster the reaction rate.
Experiment - Particle Size and Rate of Reaction
In this experiment you will investigate the relationship between particle size and rate of reaction.
Equipment
- safety glasses
- heat proof mat
- basin
- boiling tube
- delivery tube
- test tube rack
- burette
- burette stand
- timer
Chemicals
- Three different sizes of marble chips
- 1.0 mol l-1 hydrochloric acid
Procedure
Watch your teacher demonstrate how to carry out this experiment safely.
Results
Record your data in a table like the one below.
| Time (s) | small chips | medium chips | large chips |
|---|---|---|---|
| Volume (cm3) | Volume (cm3) | Volume (cm3) | |
| 0 | |||
| 15 | |||
| 30 | |||
| 45 | |||
| 60 | |||
| 75 | |||
| 90 | |||
| 105 | |||
| 120 |
Graph
Plot a graph of your results. Your graph should be similar to the one in the section on interpreting graphs.
Conclusion
Write a conclusion that links what you have found out about the relationship between particle size and rate of reaction.
Concentration
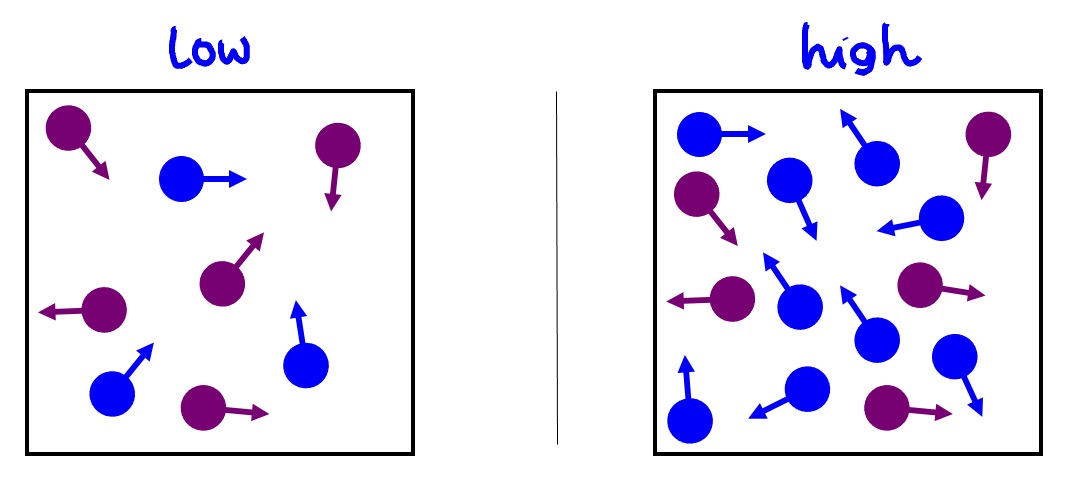
The higher the concentration, the higher the number of particles.
The higher the number of particles, the greater the chance of collisions that can occur.
The greater the number of collisions, the faster the reaction.
Therefore the higher the concentration, the faster the reaction rate.
Experiment - Effect of Concentration
In this experiment you will investigate the relationship between concentration and rate of reaction.
Equipment
- safety glasses
- heat proof mat
- basin
- boiling tube
- delivery tube
- test tube rack
- burette
- burette stand
- timer
Chemicals
- One size of marble chips
- hydrochloric acid of concentration 0.5, 1.0 and 2.0 mol l-1
Procedure
Watch your teacher demonstrate how to carry out this experiment safely.
Record your data in a table like the one below.
| Time (s) | 0.5 mol l-1 acid | 1.0 mol l-1 acid | 2.0 mol l-1 acid |
|---|---|---|---|
| Volume (cm3) | Volume (cm3) | Volume (cm3) | |
| 0 | |||
| 15 | |||
| 30 | |||
| 45 | |||
| 60 | |||
| 75 | |||
| 90 | |||
| 105 | |||
| 120 |
Graph
Plot a graph of your results. Your graph should be similar to the one in the section on interpreting graphs.
Conclusion
Write a conclusion that links what you have found out about the relationship between concentration and rate of reaction.
Temperature
The higher the temperature, the higher the energy the particles have.
The higher the energy, the faster the particles move.
The faster the particles move, the more often they collide, and the more collisions have enough energy to be successful.
The greater the number of collisions, the faster the reaction.
Therefore the higher the temperature, the faster the reaction rate.
Catalysts
A catalyst speeds up a chemical reaction and this is recovered chemically unchanged at the end of the reaction.
Enzymes are biological catalysts. They catalyse chemical reactions in living things.
Following a Reaction: Collecting Gases
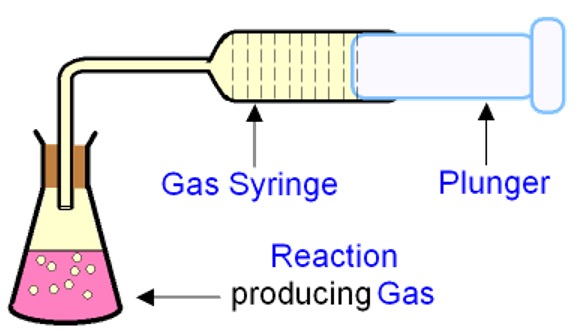
In a reaction where a gas is produced, the gas can be collected and measured at regular time intervals throughout the reaction.
Two methods that are useful for collecting gases when following a reaction are:
A - Collecting gases over water
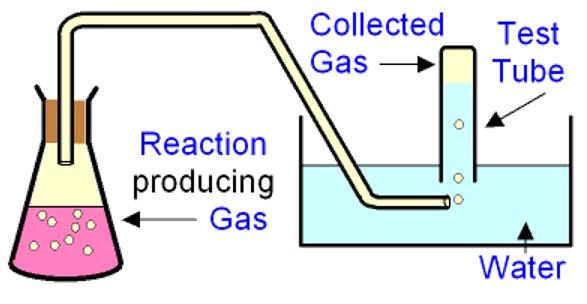
This can be used for gases that are not very soluble in water, when a dry sample of gas is not required.
B - Gas syringe
Interpreting graphs
Graphs produced from following the volume of gas released during a reaction look similar to the one below.
The following information can be determined or predicted from the graph above:
- End-point of the reaction - the time on the x-axis where the graph levels off.
- Quantity of product - the quantity on the y-axis where the line has levelled off.
- Quantity of reactant used - e.g. if half the reactants are used, half the quantity of product will be produced.
- Effect of changing conditions - increasing temperature/ concentration/ surface area will move the line closer to the y-axis.
Calculating Rate of Reaction
During the course of a chemical reaction, reactants are being converted into products.
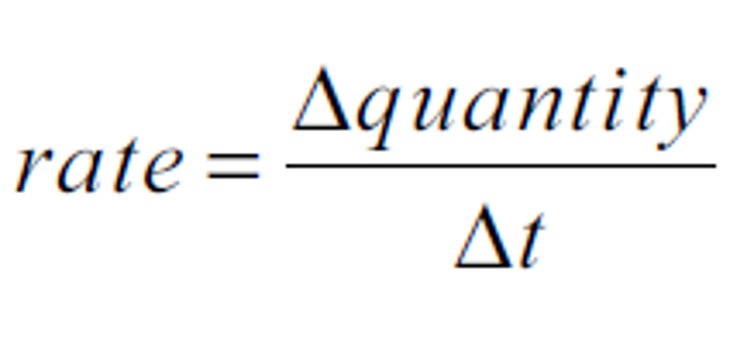
Measurement of the rate of reaction involves measuring the 'change in the amount' of a reactant or product in a certain time.
The rate of reaction changes as it progresses, being relatively fast at the start and slowing towards the end.
What is being measured is the average rate over the time interval chosen.
Reactions can be followed by measuring changes in concentration, mass and volume.
The average rate of reaction can be calculated using the formula below:
Units
The unit of quantity is followed by the unit of time and a "-1".
e.g.
20 cm3 of gas was produced in 10 minutes. Unit = cm3 min-1
or
5 g of a solid was produced in 30 seconds. Unit = g s-1
or
The concentration fell by 0.5 mol l-1 in 2 hours. Unit = mol l-1 h-1